
This guide was prepared by the MapleVend editorial team using 2026 operator income data, industry profit studies, and commercial deployment records. All figures reflect verified operator reports and industry analysis from multiple independent sources.
How much money can a vending machine make? The honest answer ranges from $40 to $1,000+ per month net profit for a single machine and the difference is almost entirely determined by location quality. A typical vending machine in a decent location generates $150 $400/month gross and $40 $120/month net. A well-placed machine at a busy warehouse or healthcare facility generates $500 $1,000/month net. A poorly placed machine at a low-traffic lobby generates $50 $150/month gross. This guide breaks down what operators actually earn at every level, what drives the differences, and what realistic income looks like for first-time operators through experienced route operators.
Browse our full range of snack, drink, and smart vending machines across all categories and price points.
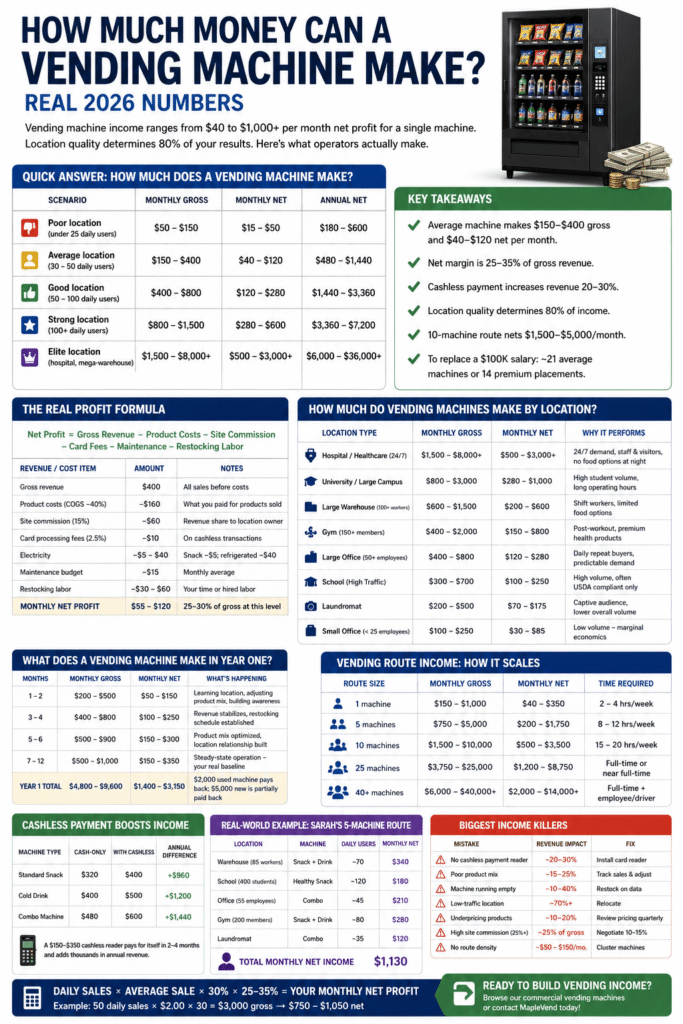
Quick Answer: How Much Does a Vending Machine Make?
| Scenario | Monthly Gross | Monthly Net | Annual Net |
|---|---|---|---|
| Poor location (under 25 daily users) | $50 $150 | $15 $50 | $180 $600 |
| Average location (30 50 daily users) | $150 $400 | $40 $120 | $480 $1,440 |
| Good location (50 100 daily users) | $400 $800 | $120 $280 | $1,440 $3,360 |
| Strong location (100+ daily users) | $800 $1,500 | $280 $600 | $3,360 $7,200 |
| Elite location (hospital, mega-warehouse) | $1,500 $8,000+ | $500 $3,000+ | $6,000 $36,000+ |
Key Takeaways
- Average vending machine generates $150 $400/month gross and $40 $120/month net per VendSoft’s June 2026 operator survey
- Net margin reality: 25 35% of gross after product costs, site commissions, card fees, and maintenance
- Cashless payment readers increase revenue 20 30% at comparable locations
- Location quality determines 80% of income the same machine performs dramatically differently in different environments
- A 10-machine route nets $1,500 $5,000/month; a 25-machine route nets $1,200 $3,000/month
- To replace a $100K salary requires approximately 21 average machines or 14 premium placements
The Real Profit Formula
According to VendSoft’s June 2026 profit analysis, the net profit formula for a vending machine is:
Net Profit = Gross Revenue Product Costs (COGS) Site Commission Card Processing Fees Maintenance Restocking Labor
In practice, net margins run 25 35% of gross revenue. Here’s what that looks like on a machine generating $400/month gross:
| Revenue/Cost Item | Amount | Notes |
|---|---|---|
| Gross revenue | $400 | All sales before costs |
| Product costs (COGS ~40%) | $160 | What you paid for the products sold |
| Site commission (15%) | $60 | Revenue share paid to location owner |
| Card processing fees (2.5%) | $10 | On cashless transactions |
| Electricity | $5 $40 | Snack machines ~$5; refrigerated machines ~$40 |
| Maintenance budget | $15 | Monthly average across all machine types |
| Restocking labor | $30 $60 | Your time or hired labor |
| Monthly net profit | $55 $120 | 25 30% of gross at this revenue level |
Real Calculation: Warehouse Machine at $850/Month Gross
Here’s the same formula applied to a well-placed snack and drink machine at a 90-person warehouse a stronger-than-average location that illustrates what good placement actually does to the numbers:
| Item | Amount |
|---|---|
| Monthly gross revenue | $850 |
| Product costs (COGS 40%) | $340 |
| Site commission (15%) | $128 |
| Card processing (2.5%) | $22 |
| Electricity (drink machine) | $18 |
| Maintenance budget | $15 |
| Monthly net profit | $327 |
At $327/month net, a $2,000 used machine at this location pays back in just over 6 months. That’s the power of a well-chosen placement the same machine at an average office generating $400/month gross nets $55 $120/month and takes 17 36 months to pay back.
“Our warehouse machines consistently outperform office locations by almost 2:1. Shift workers rely on vending during breaks they have no other options and they come back every single shift. An office worker might skip the machine on Monday if they brought lunch. A warehouse worker on a 12-hour shift almost never does.” Route operator, VendSoft 2026 operator survey
How Operators Increase Vending Machine Profit
Experienced operators consistently apply the same set of optimizations to push machines from average performance toward strong performance. Each action below is independently verifiable and compounds with the others:
- Install a cashless reader adds 20 30% revenue at comparable locations; pays back within 2 4 months at most placements
- Raise prices gradually increase by $0.25 per item and monitor volume for 30 days; demand at captive locations is relatively inelastic and price sensitivity is lower than operators expect
- Remove slow-selling products track sales by column; replace anything that hasn’t sold in 2 restocking cycles with a proven seller; dead inventory wastes column space and capital
- Restock before empty, not on a fixed schedule a machine that runs out of a popular product on day 4 of a 7-day cycle loses 3 days of revenue on that column; use IoT alerts or check sales data before every visit
- Cluster locations geographically grouping machines within a tight radius reduces drive time per restock, lowering the effective labor cost per machine and making more frequent service visits economically viable
- Negotiate commission rates down the standard opening ask from location owners is 20 25%; experienced operators target 10 15% by emphasizing the service value they provide
- Add high-margin items to every planogram energy drinks, protein bars, and premium single-serve snacks carry 50 65% margins vs 35 45% for commodity chips; even 20% of column space in high-margin items meaningfully shifts overall machine margin
How Much Do Vending Machines Make by Location Type?
According to VendBuddy’s June 2026 operator income report, location quality determines whether a machine earns $75, $750, or even $7,500 a month:
| Location Type | Monthly Gross | Monthly Net | Why It Performs |
|---|---|---|---|
| Hospital / healthcare (24/7) | $1,500 $8,000+ | $500 $3,000+ | 24/7 staffing creates overnight demand with no food alternatives; visitor traffic adds daytime volume on top of staff purchases; shift workers on 12-hour rotations are a captive audience at 2am |
| University / large campus | $800 $3,000 | $280 $1,000 | High daily student volume across multiple buildings; extended operating hours; students purchase multiple times per day between classes |
| Large warehouse (100+ workers) | $600 $1,500 | $200 $600 | Shift workers with no nearby food options take breaks at predictable times; two-shift operations extend daily sales window; industrial workers have high caloric demand |
| Gym (150+ active members) | $400 $2,000 | $150 $800 | Post-workout purchase behavior is strong and consistent; premium product pricing (protein bars, sports drinks) is accepted; health-focused buyers support higher price points |
| Large office (50+ employees) | $400 $800 | $120 $280 | Daily repeat buyers create predictable revenue; coffee demand drives multiple daily purchases per person; limited nearby food options increase reliance on in-office vending |
| School (high traffic) | $300 $700 | $100 $250 | High volume during breaks and lunch; USDA Smart Snacks compliance required which limits product range but enables institutional placement contracts |
| Laundromat | $200 $500 | $70 $175 | Captive audience with 30 60 minute dwell time; lower visit frequency than office or warehouse; impulse purchases during wait are the primary driver |
| Small office (under 25 employees) | $100 $250 | $30 $85 | Low user count limits daily volume ceiling regardless of product mix or pricing; marginal economics on most machines |
Machine-Specific Income Examples
To make these figures concrete, here’s how specific machines perform at specific locations under typical operating conditions:
- A refurbished Dixie Narco 501E placed in a warehouse serving approximately 90 employees generates $600 $900/month gross and $200 $350/month net under typical operating conditions paying back a $1,500 purchase price in 5 8 months.
- A used AP 113 snack machine at a 60-person office building generates $350 $550/month gross and $120 $200/month net paying back a $1,800 used purchase in 9 15 months.
- A new Seaga combo machine at a busy laundromat generates $300 $500/month gross and $100 $175/month net with a $3,500 new machine taking 20 35 months to pay back, making a used combo the stronger economic choice at this location type.
- A coffee machine at a 75-person corporate office generates $600 $1,200/month gross from daily repeat purchases with net margins of 50 65% on hot beverages making coffee the highest-margin category at office placements.
Worst Locations for Vending Machines
Understanding where vending machines underperform is as valuable as knowing where they excel. These location types consistently generate insufficient volume to justify most machine investments:
- Apartment building lobbies. Residents walk through once or twice a day with no reason to purchase they have kitchens, delivery apps, and nearby stores. Monthly gross rarely exceeds $100 $150 at most residential properties.
- Churches and religious venues. Infrequent, event-driven traffic creates inconsistent revenue. A machine that earns $80 during a Sunday event sits idle the rest of the week.
- Small offices under 15 employees. The user count ceiling is simply too low. Even at 100% participation (unrealistic), 15 employees buying once per day at $2.00 generates $900/month gross and in practice it’s much lower.
- Auto repair waiting rooms. Customers wait 1 3 hours but visit infrequently and unpredictably. Most auto repair shops don’t generate enough daily customers to sustain meaningful vending revenue.
- Low-traffic retail stores. A machine placed at a store that itself has low foot traffic inherits that traffic problem. Vending works best as a complement to existing high-traffic environments, not as a standalone draw.
- Break rooms with nearby cafeterias. When employees have a subsidized cafeteria 50 feet away, vending machine sales drop significantly the captive audience effect disappears when a better alternative exists.
What Does a Vending Machine Make in Year One?
According to VendBuddy’s 2026 operator timeline data, here’s what first-year income realistically looks like for a new operator with a single well-placed machine:
| Month | Monthly Gross | Monthly Net | What’s Happening |
|---|---|---|---|
| Month 1 2 | $200 $500 | $50 $150 | Learning the location, adjusting product mix, building customer awareness |
| Month 3 4 | $400 $800 | $100 $250 | Revenue stabilizes as buying habits form, restocking schedule established |
| Month 5 6 | $500 $900 | $150 $300 | Product mix optimized, location relationship established |
| Month 7 12 | $500 $1,000 | $150 $350 | Steady-state operation this is your real baseline performance |
| Year 1 total (cumulative) | $4,800 $9,600 | $1,400 $3,150 | A $2,000 used machine pays back; a $5,000 new machine is partially paid back |
How Much Does a Vending Route Make?
Income scales significantly with route size. According to VendBuddy’s June 2026 operator data:
| Route Size | Monthly Gross | Monthly Net | Time Required |
|---|---|---|---|
| 1 machine | $150 $1,000 | $40 $350 | 2 4 hrs/week |
| 5 machines | $750 $5,000 | $200 $1,750 | 8 12 hrs/week |
| 10 machines | $1,500 $10,000 | $500 $3,500 | 15 20 hrs/week |
| 25 machines | $3,750 $25,000 | $1,200 $8,750 | Full-time or near full-time |
| 40+ machines | $6,000 $40,000+ | $2,000 $14,000+ | Full-time + employee/driver |
These route estimates assume a mix of average and premium-performing locations. Operators whose entire route consists of average locations should expect lower totals closer to $40 $120/month net per machine, putting a 10-machine route at $400 $1,200/month net and a 25-machine route at $1,000 $3,000/month net. The higher ends of the ranges above assume a meaningful portion of machines are at strong or premium placements. To replace a $100,000 salary, VendBuddy’s analysis indicates you need approximately 21 average-performing machines or 14 premium placements at hospitals, universities, or large industrial facilities.
What the Average Vending Machine Actually Makes
Two independent 2026 sources provide the most reliable baseline figures:
VendSoft (June 2026): “A typical vending machine generates $150 $400 in monthly gross revenue, with net margins of 25 35% roughly $40 $120 in monthly take-home per machine after product, location commission, fuel, and maintenance costs.”
Vendingpreneurs (2026): “On average, a single machine generates between $100 and $500 per month in profit after expenses… Vending machines average $250 monthly net profit per unit in 2026 U.S. data.”
The honest baseline: $40 $250/month net per machine is realistic for most operators at most locations. The $500 $1,000+/month figures are real but represent the top 20% of placements hospitals, large universities, busy manufacturing plants not the typical first placement.
How Cashless Payment Affects Vending Income
According to 2026 operator data from Vendingpreneurs, credit card readers boost vending machine sales by 20 30% at comparable locations. Here’s what that means in practice:
| Machine Type | Cash-Only Monthly Gross | With Cashless (+25%) | Annual Difference |
|---|---|---|---|
| Standard snack machine | $320 | $400 | +$960/year |
| Cold drink machine | $400 | $500 | +$1,200/year |
| Combo machine | $480 | $600 | +$1,440/year |
A $150 $350 cashless reader retrofit pays for itself within 2 4 months at a typical location and generates thousands of dollars in additional annual revenue over the machine’s lifespan. For more on the cashless vs cash comparison, see our cashless vs traditional vending machines guide.
What Separates High-Earning Operators from Average Ones
According to VendSoft’s 2026 analysis, the top 20% of vending operators significantly outperform the average by combining:
- Premium location selection. High earners don’t accept marginal locations they wait for placements at hospitals, large warehouses, universities, and high-traffic industrial facilities where daily user counts justify the machine type.
- Data-driven restocking. Using IoT telemetry or sales tracking to restock only when needed not on a fixed schedule reduces unnecessary trips and ensures popular products never run out.
- Product pricing optimization. Charging $2.00 instead of $1.75 for a bag of chips increases margin without reducing volume at most captive locations. Top operators review and adjust pricing quarterly.
- Route density. Running machines in geographic clusters reduces driving time and makes each service visit more efficient lowering the per-machine labor cost meaningfully.
- Cashless payment as standard. Every machine has cashless capability not as an upgrade but as a baseline requirement for maximizing transaction value.
Honest Assessment: Is Vending Machine Income Worth It?
According to VMFS USA’s June 2026 operator report, a well-placed snack and beverage machine realistically generates $300 $600 in net profit per month. Machines in high-traffic spots like hospital waiting rooms, factory break rooms, and university dorms can push $800 $1,200/month gross but that is the exception, not the rule.
What vending income is good for:
- Building a side income that grows with each machine added
- Creating semi-passive income streams that require maintenance but not constant attention
- Building a route-based business that scales toward full-time income over 2 4 years
What vending income is not:
- Fast passive income machines require consistent management, especially in year one
- A get-rich-quick opportunity the numbers are real but they build slowly
- A replacement for a full-time income from a single machine
Vending Machine Income by Machine Type
| Machine Type | Avg Monthly Gross | Avg Monthly Net | Best Location |
|---|---|---|---|
| Standard snack machine | $300 $600 | $90 $210 | Office, warehouse, school |
| Cold drink machine | $350 $700 | $100 $245 | Gym, warehouse, outdoor |
| Combo machine | $350 $750 | $100 $260 | Small offices, laundromats |
| Coffee machine | $500 $1,500 | $200 $600 | Large offices, hotels |
| Healthy snack machine | $400 $900 | $150 $350 | Schools, hospitals, gyms |
| Smart / IoT machine | $500 $2,000 | $175 $700 | High-traffic connected routes |
Vending Machine Income by State
Vending machine income varies by state due to differences in minimum wage (which affects site commission negotiation), electricity costs (which affect refrigerated machine margins), population density (which affects location quality), and average consumer spending power. Here’s how the five largest U.S. vending markets compare:
| State | Key Factors | Average Net vs National | Best Location Types |
|---|---|---|---|
| California | High electricity costs ($0.25+/kWh), high consumer spending, dense urban markets, competitive placement market | +10 20% gross; electricity reduces net on refrigerated machines | Tech offices, healthcare, universities premium pricing accepted |
| Texas | Lower electricity rates, large industrial workforce, growing urban centers, less saturated market than coastal states | Near national average; lower operating costs improve net | Manufacturing, oil/gas facilities, large warehouses, logistics hubs |
| Florida | Tourism-driven locations, seasonal variation, outdoor/hotel demand, year-round warm weather drives drink machine volume | Seasonal highs above average; lower in off-season tourist areas | Hotels, airports, tourist areas, retirement communities |
| New York | Highest density of premium placements (hospitals, universities, corporate offices), highest site commissions, high consumer prices accepted | +15 30% gross at premium locations; site fees can reduce net | Healthcare, financial offices, transit hubs, large corporate campuses |
| Illinois | Strong manufacturing base, large Chicago corporate market, mid-range electricity costs, competitive but accessible placement market | Near national average; industrial placements perform well | Manufacturing, warehousing, corporate offices, healthcare |
Real-World Income Example: Sample Five-Machine Route
The following example illustrates realistic monthly net income for a part-time vending operator running five machines across different location types based on typical performance figures from 2026 operator data:
| Location | Machine Type | Daily Users | Monthly Net |
|---|---|---|---|
| Warehouse (85 workers, 2 shifts) | Snack + drink (separate) | ~70 | $340 |
| School (middle school, 400 students) | Healthy snack machine | ~120 | $180 |
| Office building (55 employees) | Combo machine | ~45 | $210 |
| Gym (200 active members) | Snack + drink (combo) | ~80 | $280 |
| Laundromat (busy urban location) | Combo machine | ~35 | $120 |
| Total monthly net income | $1,130 | ||
This sample operator spends approximately 10 12 hours per week restocking and servicing all five machines. Total machine investment: $9,800 (mix of used and refurbished equipment). At $1,130/month net, the full investment pays back in approximately 9 months from when the fifth machine was placed. Note that three of the five locations in this example perform above the national average the warehouse, gym, and school each generate stronger-than-typical foot traffic. These route estimates assume a mix of average and premium-performing locations. Operators whose entire route consists of average locations should expect lower totals, closer to the $40 $120/month net per machine baseline.
Biggest Vending Machine Income Killers
| Mistake | Revenue Impact | Fix |
|---|---|---|
| No cashless payment reader | 20 30% revenue | Install a Cantaloupe ePort or Nayax reader ($150 $350) |
| Poor product mix (wrong products for location) | 15 25% revenue | Track sales by column replace slow movers within 30 days |
| Machine running empty between restocks | 10 40% revenue | Restock on data (IoT alerts or sales tracking), not fixed schedule |
| Low-traffic location (under 25 daily users) | 70%+ vs good location | Relocate a machine in a poor location can’t be fixed with product changes |
| Underpricing products | 10 20% margin | Review pricing quarterly raise by $0.25 and monitor volume impact |
| High site commission (25%+) | 25% of gross | Negotiate 10 15% as the standard starting point; walk away from 25%+ agreements |
| No route density (machines spread too far apart) | $50 $150/month in labor | Cluster machines within a tight geographic zone to reduce driving time per restock |
Vending Machine Income by Machine Type and When It Pays Back
Machine type and age affect income through two levers: cashless payment capability (which adds 20 30% revenue) and reliability (which reduces costly downtime). The table below combines both income and payback data so you can evaluate total value rather than just sticker price:
| Machine | Purchase Cost | Typical Monthly Net | Estimated Payback |
|---|---|---|---|
| Used snack machine (cash only) | $800 $1,500 | $60 $150 | 8 20 months |
| Used snack machine (cashless retrofit) | $1,200 $1,800 | $90 $200 | 8 18 months |
| Refurbished combo (cashless included) | $2,000 $3,000 | $120 $250 | 10 22 months |
| New snack or combo machine | $3,500 $5,500 | $130 $280 | 14 38 months |
| New coffee machine | $4,000 $7,000 | $200 $600 | 10 30 months |
| Smart / IoT machine | $6,000 $12,000 | $250 $700 | 12 40 months |
The clearest practical insight: a used snack machine with a $150 $350 cashless retrofit often generates comparable monthly net to a brand-new machine at a fraction of the upfront cost and pays back faster as a result. For a full comparison, see our new vs used vending machine guide. Payback figures above assume good-location performance; at average locations, payback is proportionally longer.
Related Guides
- Most Profitable Vending Machine which machine type maximizes your return
- How Much Does It Cost to Stock a Vending Machine? understanding COGS and margins
- New vs Used Vending Machine full cost and ROI comparison
- Used Vending Machines for Sale browse current used inventory
- Snack Vending Machines for Sale snack machine options at every price point
- Drink Vending Machines for Sale cold drink machines new and used
- Coffee Vending Machines for Sale highest per-transaction margin category
- Cashless vs Traditional Vending Machines how cashless increases income 20 30%
- Vending Machine Route for Sale buying proven income from day one
- Best Vending Machine for Small Business matching machine to location
Frequently Asked Questions
How much money can a vending machine make per month?
A typical vending machine generates $150 $400/month gross and $40 $120/month net at an average location. Well-placed machines at hospitals, large warehouses, and universities generate $500 $1,000+/month net. The average across all placements per VendSoft’s June 2026 data is approximately $40 $120/month net per machine.
How much does a vending machine make per day?
A typical vending machine at an average location generates $5 $15/day gross. A well-placed machine at a busy location generates $20 $50/day. Elite placements at hospitals or large warehouses can generate $100 $300/day. Divide your monthly gross target by 30 to estimate your required daily sales volume.
How much does a vending machine make per year?
At average performance ($150 $400/month gross), a single machine generates $1,800 $4,800/year gross and $480 $1,440/year net. A well-placed machine at $600 $1,000/month gross generates $7,200 $12,000/year gross and $1,800 $4,200/year net.
Can you make $1,000 a month from a vending machine?
Yes but it typically requires either a premium placement (hospital, large university, mega-warehouse) generating $1,000+/month from a single machine, or 3 5 machines at good locations each generating $200 $350/month net. Most single-machine operators at standard locations generate less than $1,000/month net.
How many vending machines do you need to make a full-time income?
Based on VendBuddy’s 2026 analysis, replacing a $60,000 $80,000 salary requires approximately 15 25 machines at average-to-good locations ($200 $350/month net each), or 8 14 machines at premium placements ($400 $600/month net each). Most operators reach full-time income equivalent after 2 4 years of steady route building.
Is $250/month per machine realistic for a vending machine?
Yes $250/month net is close to the average performance figure across all machine placements in 2026 U.S. data. It’s achievable at a decent 40 60 daily user location with proper product mix and cashless payment. It’s not guaranteed poor locations can underperform this significantly, and strong locations can substantially exceed it.
Is vending machine a good side hustle?
Yes vending is one of the most time-efficient side hustles available. A single machine at a good location requires 2 4 hours/week including restocking, purchasing, and basic maintenance. Monthly net income of $80 $150 from one machine is realistic at a standard commercial location. At 3 5 machines generating $100/month net each, a vending side hustle produces $300 $500/month for 8 12 hours of work per week an effective hourly rate that improves as the route grows denser geographically.
Do vending machine owners make good money?
Yes at scale. A single machine generates $75 $150/month net at average locations. A 10-machine route at good locations generates $800 $2,000/month net. A 25 30 machine full-time route generates $3,000 $6,000+/month net. The income scales with route size, location quality, and how actively the operator manages product mix and pricing. Owners who treat it as a managed asset business consistently outperform those who treat it as passive income.
Do you have to pay taxes if you own a vending machine?
Yes vending machine income is taxable business income. You must register for a state sales tax permit (vending sales are taxable in nearly every state) and file business income taxes. Operating as an LLC or sole proprietor both require reporting vending income. Business expenses machine cost, product, delivery, maintenance, insurance, and mileage are deductible against vending income. Failure to collect and remit sales tax is one of the most common and costly compliance mistakes new operators make.
Do you need insurance for vending machines?
General liability insurance is strongly recommended many location managers require proof of insurance before signing a placement agreement. General liability for vending operators costs $100 $300/year and protects against property damage claims and product liability issues at locations. Some operators also carry inland marine (equipment) insurance to cover machines against theft or damage. The annual cost of insurance is minimal relative to the liability protection it provides and the placement agreements it enables.
Can I own a vending machine without a license?
You can own a vending machine without a license, but you cannot legally operate it commercially without the appropriate permits. Most U.S. states require at minimum a business license and a state sales tax permit. Some states require per-machine registration or decals. Fresh food vending typically requires a health department permit. Operating without required licenses risks back-tax bills, fines, and removal of machines. Licensing costs are typically $200 $500 for the first year a minor expense relative to the liability of operating unlicensed.
Can I just set up a vending machine anywhere?
No you need a signed placement agreement with the property owner for every location. On public property, a municipal vending permit is required. Operating a machine without permission on private property risks immediate removal and legal liability. The most legally straightforward placements are private commercial locations offices, warehouses, gyms where you negotiate directly with the property manager and sign a standard placement agreement covering revenue share terms and duration.
Is a vending machine business worth it in 2026?
Yes for operators who secure strong locations before buying equipment, enable cashless payment from day one, and manage product mix actively. The startup cost is low ($2,000 $5,000 for a first machine all-in), the revenue is recurring, and the path to scale is clear. A $2,000 used machine generating $120/month net pays back in 17 months and generates $1,440/year ongoing from a one-time investment that requires 3 5 hours/week to maintain.
What is replacing vending machines?
Micro-markets are replacing traditional vending at large corporate locations with 200+ employees. Smart vending machines are upgrading traditional machines at premium placements. For the vast majority of commercial vending locations offices under 100 employees, warehouses, gyms, schools, laundromats traditional machines remain the most cost-effective solution and are not being meaningfully displaced. The income potential from traditional vending in 2026 is unchanged at these core location types.
The Bottom Line on Vending Machine Income
The machine itself is rarely the deciding factor in vending machine profitability. A modest used snack machine with a cashless retrofit at a high-traffic warehouse will consistently outperform a brand-new premium machine placed in a low-traffic lobby because location volume multiplies everything else: margin, daily sales, and annual return.
The operators who build meaningful vending income follow the same pattern: secure quality locations first, then optimize product mix and pricing, then scale by adding machines at additional strong locations. The machines are the tool. The locations are the business.
For most first-time operators, the right starting point is a used or refurbished machine at $1,500 $2,500 placed at a proven location with 50+ daily users not the highest-margin specialty machine or the newest technology. Prove the location, learn the operation, then scale from a position of verified income rather than projected income.
Ready to build vending machine income? Browse our commercial vending machines for sale or contact MapleVend to discuss which machine type and location strategy fits your income goals.
